Sunday, December 20, 2015

Double top in QQQ?

A 18-month daily chart of QQQ:


Next, let's zoom in on the potential second peak:


Now let's look at a 2-year daily chart of SPY:


I see a possible 20-month H&S top where the head is itself a 6-month H&S top (from which SPY broke down during the August sell-off). After rallying for 4 months from the August 2015 low, SPY now has a potentially very bearish set-up. Let's zoom in on the last 6 months:


 As of the market close on Friday, December 18, I see a potential breakdown from a 4-month channel as well as a completion of a 6-week horn top. Of course, nobody knows where the market will go on Monday and beyond. Both QQQ and SPY can rally off support levels and invalidate our set-ups. The only things we can control are our trade entries and risk management.

Merry Christmas!

Friday, November 13, 2015

3-week H&S top in Nasdaq 100 (QQQ ETF)

After the heightened volatility of August and September, QQQ rallied more than 10% off the the September lows as seen in the following daily chart:
 

In the process of rallying to all-time highs, QQQ formed a 3-week H&S top. The following 30-minute chart shows the H&S top more clearly:


So is the top in and we're headed for another plunge? Nobody knows. It could be that this relatively small H&S top has already served its purpose. After all, it has already declined almost to the measured price target. And now the QQQ could start another strong rally to all-time highs.

But small patterns can also start huge declines. In late 2012, a 1-month H&S top started a 40% decline in the price of Apple stock.

The only thing we can control and should concern ourselves with is limiting our risk. Enter trades only at advantageous spots and quickly cut losses by using stop-loss orders.

Friday, September 18, 2015

Long-term bonds: trying to break out?

Let's look at the chart of TLT:

 
TLT broke out of a 6-month channel in August and has been retesting the channel's upper boundary for three weeks. Now, it is trying to break out of a 3-week channel.

In my chart trading mode, I don't make macroeconomic predictions or engage in economic analysis. Instead, I follow the price. Still, it is fun to think about the implications of particular price moves. If stocks struggle while long bonds shoot higher, we might suspect that the economy is slowing and/or investors and traders fear deflation. Then of course there is what the Federal Reserve may do in response to low inflation expectations (QE 4?) and the Fed's effect on stocks, bonds, and commodities.

Or, we can just follow the price.

Thursday, September 17, 2015

UPDATE: S&P 500

Let's look at the SPY chart:


For three weeks an ascending triangle has been forming. Today SPY broke above the horizontal upper boundary in a seemingly decisive breakout. But by the end of the day prices reversed and closed at a loss: a classic reversal day.

Now what?

First, the strong reversal was not so surprising. After all, there is strong resistance in the 200 to 203 level.

Second, today's reversal does not preclude another breakout attempt that may take SPY to new all-time highs.

Third, anything is possible. Patterns can morph and change into something else over a matter of days. The ascending triangle? Over the next several days it may become a bearish rising wedge that produces a decisive breakdown. 

All we can do is accept the price action and trade when the reward-to-risk ratio is favorable.

Wednesday, September 9, 2015

Analysis of U.S. stock indexes

Last month, we discussed possible topping patterns in U.S. stock indexes and individual stocks. Let's see what the charts have done in the two weeks since the start of heightened volatility.

Let's look at the SPY (S&P 500) chart:


We see a dramatic breakdown from a 6-month H&S top. Prices rebounded from the October 2014 low and have been coiling in a pennant pattern for 2 weeks.

Today SPY was decisively turned back at the 198-199 resistance (formerly support) level. This rejection does not mean that the current 2-week coiling pattern will become a bear pennant that continues the decline. There are no "musts" and "shoulds" in trading other than the utmost importance of limiting our risk on every trade. The current coiling pattern can launch a move up and retest the 204 level and even beyond. Again, there are no guarantees in the market. Especially this market, which has been an epic bull run since the March 2009 low. We must be open to all possibilities. And it is possible that the market will break down and ultimately become a harsh bear market but only after SPY races back up to 204 or even a new all-time high.

So we must keep our eyes open and accept the price action as it is. If we are short, then we must have a strict stop level at which we cover our shares - no ifs or buts. The same for longs: we must stick to our stop level where we will sell and cut our losses.

Please remember that there will always be more set-ups to trade. Let the price action tell you the market's intention. Prices are coiling now. That means the market can go up or down. If it breaks down, then we might look for an advantageous entry spot for shorting. If it breaks up, then look for a good spot to go long . Or, don't trade. We are not required to trade. Doing nothing is often the most profitable move.

Stay patient. We need psychological experience in the market, and that comes through living through a complete market cycle. Then we have a chance of accepting what we see rather than what we want to see.

Thursday, August 20, 2015

NYSE completes H&S top

Last month we discussed whether the NYSE index was forming a H&S top within a bearish rising wedge. Today's price action suggests that the NYSE index has completed a significant topping pattern:


Other U.S. indexes are at critical support levels. As we discussed yesterday, IWM (Russell 2000) seems to be breaking down from a H&S top.

Remember, we must trade the actual price action rather than our wishes. I lose sight of this truth often. And the warning applies to both bears and bulls. Long-suffering bears may - may - be getting the breakdown that they have been waiting for so long. But this epic bull market has made countless stick saves to continue its run higher. We must trade with discipline and respect our stops. If we are bullish, then we may be proved right again. But we, too, must respect our stops if the market continues to break down. The stock market lost more than half of its value during the 2007 to 2009 financial crisis and 90% of its value during the Great Depression. And yes, these events will happen again for human nature is constant.

Making money is not the traders' priority. There will always be more compelling set-ups. Our priority is surviving and protecting our capital.

Wednesday, August 19, 2015

Analysis of U.S. stock indexes

The current bull market that started in March 2009 has been epic. Again and again, at key moments, the market bounced from key support levels. Countless Head & Shoulders Top patterns turned into H&S Top Failures that started yet another run higher. Countless sideways trading became continuation patterns that started the next leg higher. The market survived key tests and thrived.

We seem to be at another key test. Let's first look at 6-year weekly chart of SPY (S&P 500):


A historic run where the market has gained more than 200% in 6 years. Next, let's look at a 3-year weekly chart that shows a possible 3-year trendline support:


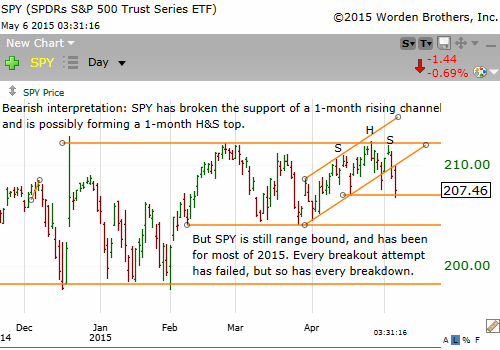
Next, a daily chart focusing on the past 10 months:


Intriguing possibilities. But, stocks have not broken down so far. And they haven't for 6 years. An epic breakdown is possible, but it is only a possibility. And there are good reasons to think that the market will bounce yet again. SPY is resting and finding support at its 200-day moving average. If the 200-day is pierced, then there is likely to be strong support around the 205 level.

So several things have to happen before a breakdown is confirmed. My approach is to stay patient and let the market point the way. There is no need to try to predict. We cannot. Instead, we should let the market declare its intention. We'll likely find a good entry spot even after the fact.

Let's look at IWM (Russell 2000) for comparison. I find the IWM chart the most interesting among the indexes.

First, a 6-year weekly chart:


IWM is up 265% since the financial crisis low. Will it continue higher or is a reversal near? Let's look at a 10-month daily chart:


Next, let's focus on the past 5 months:


Such a pattern within a pattern is always interesting but never guarantees a set-up will work. In fact, the more intriguing the pattern, the more dangerous. Why? Because we get obsessed with the set-up "working" and producing the wished-for outcome rather than trading the actual price action.

So, for now, we should be aware of the potential set-ups. Then we must have the patience and strength to let the market show us the way.

Monday, August 3, 2015

Ralph Lauren breaking down from a 3-year topping pattern

Let's look at the weekly chart of Ralph Lauren:


From about $30 a share at the financial crisis lows of 2009 to almost $200 a share in mid-2013, Ralph Lauren has mirrored the current historic bull market. Now, however, Ralph Lauren may have topped out and started a significant down trend. The next chart is a daily chart that focuses on the previous 18 months:


We see a 5-month continuation rectangle that could propel the breakdown.

Warning: Ralph Lauren is due to release is next earnings report on August 5, 2015. The market's response to an earnings release is unpredictable. I exit from all or most of my position before an earnings release no matter how promising the pattern. The only exception is if I am sitting on a significant profit. If I were not in this trade yet, I would wait for the dust to settle from the earnings release and then evaluate whether there is an attractive entry opportunity. If no entry spot presents itself, I must remember to let this trade go - because there will always be other opportunities.

Thursday, July 30, 2015

H&S top in Huntsman (HUN)

Here is the 6-year weekly chart of HUN:


Next is the 2-year daily chart showing a massive 22-month Head & Shoulders Top:


As always, don't chase. If we wish to short this set-up, we could wait for rallies to the $21 level and set our stop somewhere around $22. Such an entry has a more favorable reward-to-risk ratio than hastily shorting around $19 - but that's just one possibility. We need to determine our risk tolerance and comfort level. It is always best to err on the side of caution.

What if there are no retests of the neckline that give us a more favorable entry spot? Then let this trade go. There will be many more opportunities. Stay patient. 

And, of course, every pattern - no matter how well-defined and textbook, can fail. We must respect our stops and move on when a pattern fails and becomes something else.

Monday, July 27, 2015

Analysis of US stock indexes

First, a 15-month daily chart of SPY:


Stocks have traded in a tight range since December 2014 and especially since February 2015. The profitable approach has been to buy weakness and sell strength. Will this playbook change? Let's look at the other indexes.

The next chart is the NYSE index:


In April 2015, we considered whether the NYSE index was breaking out of a massive continuation H&S bottom to start yet another uptrend in our current epic bull market. Now, a much more bearish possibility seems likely. Repeated attempts to close and stay above the 11,100 level failed and the NYSE is now breaking down from a possible bearish rising wedge. Prices are breaking down after retesting the lower boundary. The next critical test will be the 10,650 level that provided support at the lows of March and early July. If 10,650 does not hold, then the NYSE will have broken down from a well-defined H&S top within a rising wedge:


Stay patient and calm. Participate with the trend rather than trying to predict the trend - which is impossible. And remember: if we don't want to trade, then we don't have to trade.

Sunday, July 26, 2015

FedEx: Reversal or Consolidation for the Next Leg Up?

Let's look at the weekly chart of FedEx:


After recovering from the financial crisis low of 2009, FedEx formed a massive 3-year continuation Head & Shoulders Bottom that launched the current uptrend.

Next is the daily chart:


FedEx has formed a textbook rectangle and its stock price is at the crucial 164 support level. A decisive close below 164 would complete a reversal rectangle with a price target of around 144. Of course, FedEx can bounce from the 164 support level and the rectangle become yet another continuation pattern that starts yet another uptrend. Stay patient and follow the trend rather than anticipating or predicting the coming move.

Thursday, July 23, 2015

Gold: chart analysis $GLD

First, the weekly chart of GLD:


Next, the 2-year daily chart:


We could argue that GLD's decline this week was launched by a well-formed continuation descending triangle. That said, prices can do anything, including going back up to the 110 level or beyond. Remember: patterns fail often. Should GLD continue to decline, there may be support at 100, which was resistance in 2008 and 2009. If 100 does not hold as support, then I see 84 as the next major support level. But first, let's watch for a retest of the 110 level.

Intel: increasing weakness amid a potentially massive top

Here is Intel's chart:


Prices have closed below the neckline of a possible H&S top. Caution seems appropriate for both longs and shorts. If we are long in Intel shares, we have to consider the possibility that a big topping pattern has been triggered. If we are short or looking to short, then we can't be overconfident because prices may close above the neckline in a hard retest. And, of course, every pattern can fail and change into something else.

Thursday, July 16, 2015

Gold Miners $GDX: starting another big move down?

Let's look first at the weekly chart of GDX going back to 2006:


Gold miners have made a round trip since the financial crisis lows. Next, let's look at the 1-year daily chart:


I see a well-defined continuation H&S top. But just below is the potential support of the 2008 low. It will be intriguing to see which possibility - a massive continuation H&S top that continues the downtrend vs. the possible support (buying) that may arise around the 2008 lows - plays out.

When I discussed this possible continuation H&S top in April, I suggested that the right shoulder could turn out to be a bullish running wedge that turns this possible continuation H&S top into a continuation H&S top failure, which I consider a distinct pattern with powerful bullish implications. But by early June it became clear that the right shoulder was indeed a bearish rising wedge. And it's fine to be wrong - traders will be wrong most of the time. What's important is not losing much - if any - of our trading capital when we are wrong. And one way to minimize our losses is to enter a trade only at advantageous spots. Thus, we would not chase the recent decline even if not chasing means we sit out this trade. Prices may retest the neckline in the coming weeks or months. Such a retest would offer a much more advantageous entry. But if there is no retest, then we should remember: there will always be more set-ups.

Tuesday, July 14, 2015

Stocks are still range bound. Stay patient. Not trading is a strategy.

Even with the volatility attributed to the ongoing Greek debt problems, China's stock market decline, and other uncertainties, U.S. stocks are trading in a tight range, as they have been throughout 2015:


In this kind of range-bound trading, the higher probability trade is to sell or short strength and buy weakness. Stocks will break out of this range at some point. When the breakout, up or down, occurs, our task is to accept the price action and trade (or not trade) accordingly.

Update: Intel ($INTC) earnings release tomorrow

We discussed a possible H&S top forming in Intel. Intel is set to release its second-quarter earnings tomorrow. I almost always exit my position before the earnings report no matter how promising the set-up. Staying with a position hoping for a favorable reaction to an unknowable earnings report is unnecessary gambling. Sometimes I stay with a small position if I have a favorable entry point or, more likely, my emotions have gotten the better of me. Remember, there will always be other opportunities.

Thursday, July 9, 2015

Wells Fargo $WFC: bearish ascending wedge?

Let's look at the daily chart of Wells Fargo:


I interpret this chart as a possible 7-month bearish ascending wedge with a 1-month H&S top in the last part of the wedge. A smaller pattern within a larger pattern can often launch a breakout from the larger pattern. Also, I sometimes see prices trade above the upper boundary of an ascending wedge, as they did here, before they return inside the pattern and break down.

These are mere possibilities and never guarantees. That said, I always find interesting the pattern-within-a-pattern as it can provide an early entry point or additional support for a particular interpretation. But there is a risk to such fascination: I must be careful not to obsess over a particular outcome and ignore the actual price action. I will re-evaluate my interpretation should prices close above the right shoulder high of the H&S top.


Tuesday, July 7, 2015

Massive H&S top in Intel (INTC)? QQQ SPY DIA

Here is a weekly chart of Intel (INTC):


Intel is testing a 2.5 year trendline support and may be also trying to break down from a massive H&S top. The meeting of two major technical development is always interesting. That doesn't mean that the H&S top is guaranteed to work and produce a significant epic decline. Prices may recover and stay above the multi-year trendline and invalidate the H&S top interpretation. We have to avoid being obsessed with a certain outcome. Instead, we must accept the actual price action. Believe what we see, not what we want to believe.

Let's end with the daily chart of INTC:


Again, traders must focus on protecting our trading capital. We need not chase a breakout if it means risking more than prudent. There will always be other trader.

It's also interesting to consider the implications for the broader market should this H&S top interpretation prove correct. But remember, we must not get too attached to a particular interpretation. Focus on entering a trader at an advantageous spot that limits risk. If we miss a breakout, so be it. Let it go and confidently and calmly wait for the next attractive set-up.

Sunday, July 5, 2015

SPY: Was that a Head & Shoulders Top?

Last week, we discussed various bearish possibilities for the U.S. stock indices, including a possible H&S top in SPY.

The following chart shows SPY forming a possible bear flag after the initial decline:


Whatever our interpretation of the current market, remember that our priority is protecting our capital and not making money. There will always be other set-ups to trade.


Monday, June 29, 2015

Reversal symmetrical triangle completed in Nasdaq 100 (QQQ)?

The U.S. stock indices dropped over 2% today. Let's examine the charts. First, the QQQ:


As indicated on the chart, today's drop may start a significant decline. But the market does not follow a script. Stocks can and will do anything. As traders, we can only evaluate the potential rewards against the risks of trading a set-up.

Let's look at SPY:


SPY also possibly completed a bearish pattern today: a 3-month Head and Shoulders top. It now rests on its 200-day simple moving average.

Finally, let's look at a 1-year chart of the NYSE index:


What seemed like attempts to break out (up) of a 9-month continuation H&S bottom has now turned into something else. Yes, stocks can still go up from here, but let's consider another possibility. The next chart focuses on the last 6 months:


We see a possible bearish broadening top (megaphone) and today's decline may have completed the pattern. But remember that classical charting is about possibilities and never predictions or guarantees. Stocks may recover quickly from today's decline and invalidate this broadening top interpretation. Keep an open mind.

Tuesday, June 23, 2015

Chart analysis of Ford Motor

We discussed last month a possible bearish chart pattern in Ford:


The price target of the 3-month Head & Shoulders Top was met in early June:


So what now? The next chart offers a possible bullish interpretation for Ford:


Remember, this breakout from the channel is only a possibility. Also, channel breakouts are tricky to trade. The stock can decline and stop us out of our position yet stay above the descending upper boundary. When I trade a breakout from a channel, I use a smaller-than-usual position and set a wider stop.

Saturday, June 20, 2015

Where stocks stand today

SPY has traded within a tight range throughout 2015 and especially since February:


Let's see what QQQ is doing:


So stocks are range bound and possibly coiling, which is what stocks have been doing throughout the year. We could do much worse than staying patient until the market declares its intention.

Thursday, May 14, 2015

Stocks about to break out? Maybe. Stay flexible.

Stocks have been range bound throughout 2015 and especially since February. Now it seems a resolution to this range-bound trading may be at hand:


We see a breakout from a 3-week symmetrical triangle that may push SPY above resistance and possibly launch the next uptrend of this 6-year bull market.

Previously, we discussed possible bearish readings of the SPY chart. These bearish interpretations may still come true. After all, SPY has not yet decisively cleared resistance around the 212 level.

The key is not anticipating or predicting but keeping our minds open and participating with the market trend. My sense is that many traders and investors thought this 3-month congestion would lead, finally, to a meaningful decline. I have also been watching for the long-awaited correction. The decline could still happen. But I will do my best to stay mentally flexible to be able to take advantage of the actual price action.

If we are bearish and positioned accordingly, then we can try exiting our positions, clearing our mind as best as we can, and just waiting for the market to declare its intentions. The same goes for the bulls. If the breakout fails yet again, then we might try not trading until the true trend is revealed.


Wednesday, May 6, 2015

Update: $F breaking down from 3-month range-bound trading

Previously we discussed a possible bullish scenario for Ford. Now Ford is breaking down from a 3-month period of range-bound trading:


Remember, charting is all about possibilities. There are no guarantees in the market except risk. The possible breakdown in progress does not negate a possible longer term bullish scenario. But we must adjust our trading and thinking according to the price action. And the current action shows weakness. We must not solely focus on and wish for the bullish case because that's "supposed" to happen. Trading based on what "should" happen is costly.

Stocks are still range bound, but there are some interesting bearish possibilities

SPY has dropped 2% over 2 days, but it is still range bound :


In fact, we noted previously how SPY has been range bound for most of this year.

If we were to make a case for continued weakness in stocks, then we could point to SPY breaking below support of the rising channel/bear flag. There is also a possible 4-week H&S top forming. That said, such small patterns usually fail and the chart goes onto form something different. Still, traders must remain flexible and be open to different possibilities.

Wednesday, April 29, 2015

Gold miners ETF (GDX) showing interesting action

First, let's look at the 18-month chart of GDX:


Gold miners dropped 40% from August 2014 to November 2014. Then it seemed to be forming a possible continuation H&S top, which, if completed, could start another decline.

Now let's focus on the last 7 months:


A textbook continuation H&S top. But look at the possible right shoulder: seems to be a rising wedge. A rising wedge is usually a bearish pattern. But sometimes the price breaks above the upper boundary and creates a bullish running wedge, as it may be doing here.

So instead of a possible textbook continuation H&S top with a textbook rising wedge as a right shoulder, we may instead have a textbook continuation H&S top failure with a running wedge as the right shoulder.

Remember, trading is about mere possibilities and never certainties. Staying mentally flexible allows us to spot patterns and trade set-ups that are opposite to our expectations. This set-up in GDX may be one of those instances.

Never chase and don't worry about what others are dong. Just because there is a "textbook" set-up does not mean it is easy to trade. Trading well means betting only when there is a highly favorable entry spot and we are able to catch it. If we miss it, so be it. There may be another opportunity to enter. Or not. But it is better to sit out a trade than chase and lose money.

There will always be more set-ups.

Traders must be flexible and consider other possibilities

Not much has happened since late 2014: SPY is trading between 200 and 210. For the past month, SPY has been in a rising channel, which is also within a 3-month trading range:


A bullish scenario is that stocks stay within this rising channel and later break above the late-February high.

A bearish scenario is that this channel could be a bearish flag that could send SPY back down to around 204.

Or it could be nothing as prices form a new pattern.

I'm not going to guess. As noted, I try to participate rather than anticipate. If we try to pre-position ourselves by making anticipatory entries, we are likely to get chopped up by this choppy range-bound trading. Staying patient is always a challenge, but we can do it.