
Gold miners have made a round trip since the financial crisis lows. Next, let's look at the 1-year daily chart:
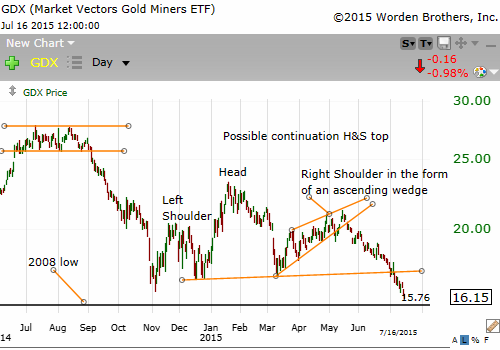
I see a well-defined continuation H&S top. But just below is the potential support of the 2008 low. It will be intriguing to see which possibility - a massive continuation H&S top that continues the downtrend vs. the possible support (buying) that may arise around the 2008 lows - plays out.
When I discussed this possible continuation H&S top in April, I suggested that the right shoulder could turn out to be a bullish running wedge that turns this possible continuation H&S top into a continuation H&S top failure, which I consider a distinct pattern with powerful bullish implications. But by early June it became clear that the right shoulder was indeed a bearish rising wedge. And it's fine to be wrong - traders will be wrong most of the time. What's important is not losing much - if any - of our trading capital when we are wrong. And one way to minimize our losses is to enter a trade only at advantageous spots. Thus, we would not chase the recent decline even if not chasing means we sit out this trade. Prices may retest the neckline in the coming weeks or months. Such a retest would offer a much more advantageous entry. But if there is no retest, then we should remember: there will always be more set-ups.
No comments:
Post a Comment