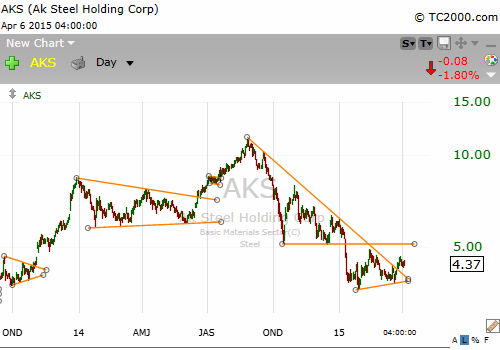
Now let's zoom in on the last 7 months or so:

Was that a trendline breakout on high volume in late March? Perhaps. Even if a breakout, I expect much back and forth and even a decline back to the trendline. Also, there is likely strong resistance at the $5 level.
AKS is a volatile and financially risky stock. If one is going to trade it, then one must use great caution. Using a small position is always a good way to limit risk. With a stock like AKS, the position size I use is the amount that, in the worst case scenario, I could lose entirely and still be a relatively minor loss for my trading account. There is nothing wrong with not trading a setup for whatever reason. Remember: there will always be more setups to trade. We must be patient.
AKS is due to release its earnings report in 3 weeks. I almost always exit my entire position before the earnings report. I think holding a stock through earnings is an unnecessary risk. There will likely be another chance to get in after the earnings announcement. And if no opportunity presents itself, then so be it. I move on.
The AKS chart shows possibly much potential as a long trade. But there is much work to be done and many hurdles to be cleared. As always, patience and strict risk control are required.
No comments:
Post a Comment