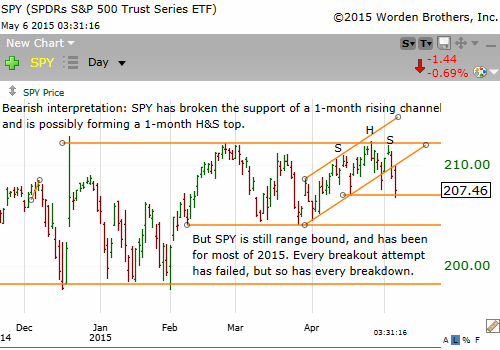
Last week, we discussed various bearish possibilities for the U.S. stock indices, including a possible H&S top in SPY.
The following chart shows SPY forming a possible bear flag after the initial decline:
Whatever our interpretation of the current market, remember that our priority is protecting our capital and not making money. There will always be other set-ups to trade.
This blog is about classical chart patterns in stocks. Just because I discuss a chart does not mean I traded it. I will never make trade recommendations, and you should not listen to those who do. We must develop our own style of interpreting and trading chart patterns. Traders have different entry and exit strategies, risk tolerances, and opinions about a chart set-up. Don't worry about what others are doing. Focus on protecting your capital while gaining market experience.
Sunday, July 5, 2015
Monday, June 29, 2015
Reversal symmetrical triangle completed in Nasdaq 100 (QQQ)?
The U.S. stock indices dropped over 2% today. Let's examine the charts. First, the QQQ:
As indicated on the chart, today's drop may start a significant decline. But the market does not follow a script. Stocks can and will do anything. As traders, we can only evaluate the potential rewards against the risks of trading a set-up.
Let's look at SPY:
SPY also possibly completed a bearish pattern today: a 3-month Head and Shoulders top. It now rests on its 200-day simple moving average.
Finally, let's look at a 1-year chart of the NYSE index:
What seemed like attempts to break out (up) of a 9-month continuation H&S bottom has now turned into something else. Yes, stocks can still go up from here, but let's consider another possibility. The next chart focuses on the last 6 months:
We see a possible bearish broadening top (megaphone) and today's decline may have completed the pattern. But remember that classical charting is about possibilities and never predictions or guarantees. Stocks may recover quickly from today's decline and invalidate this broadening top interpretation. Keep an open mind.
As indicated on the chart, today's drop may start a significant decline. But the market does not follow a script. Stocks can and will do anything. As traders, we can only evaluate the potential rewards against the risks of trading a set-up.
Let's look at SPY:
SPY also possibly completed a bearish pattern today: a 3-month Head and Shoulders top. It now rests on its 200-day simple moving average.
Finally, let's look at a 1-year chart of the NYSE index:
What seemed like attempts to break out (up) of a 9-month continuation H&S bottom has now turned into something else. Yes, stocks can still go up from here, but let's consider another possibility. The next chart focuses on the last 6 months:
We see a possible bearish broadening top (megaphone) and today's decline may have completed the pattern. But remember that classical charting is about possibilities and never predictions or guarantees. Stocks may recover quickly from today's decline and invalidate this broadening top interpretation. Keep an open mind.
Tuesday, June 23, 2015
Chart analysis of Ford Motor
We discussed last month a possible bearish chart pattern in Ford:
The price target of the 3-month Head & Shoulders Top was met in early June:
So what now? The next chart offers a possible bullish interpretation for Ford:
Remember, this breakout from the channel is only a possibility. Also, channel breakouts are tricky to trade. The stock can decline and stop us out of our position yet stay above the descending upper boundary. When I trade a breakout from a channel, I use a smaller-than-usual position and set a wider stop.
The price target of the 3-month Head & Shoulders Top was met in early June:
So what now? The next chart offers a possible bullish interpretation for Ford:
Remember, this breakout from the channel is only a possibility. Also, channel breakouts are tricky to trade. The stock can decline and stop us out of our position yet stay above the descending upper boundary. When I trade a breakout from a channel, I use a smaller-than-usual position and set a wider stop.
Saturday, June 20, 2015
Where stocks stand today
SPY has traded within a tight range throughout 2015 and especially since February:
Let's see what QQQ is doing:
So stocks are range bound and possibly coiling, which is what stocks have been doing throughout the year. We could do much worse than staying patient until the market declares its intention.
Let's see what QQQ is doing:
So stocks are range bound and possibly coiling, which is what stocks have been doing throughout the year. We could do much worse than staying patient until the market declares its intention.
Thursday, May 14, 2015
Stocks about to break out? Maybe. Stay flexible.
Stocks have been range bound throughout 2015 and especially since February. Now it seems a resolution to this range-bound trading may be at hand:
We see a breakout from a 3-week symmetrical triangle that may push SPY above resistance and possibly launch the next uptrend of this 6-year bull market.
Previously, we discussed possible bearish readings of the SPY chart. These bearish interpretations may still come true. After all, SPY has not yet decisively cleared resistance around the 212 level.
The key is not anticipating or predicting but keeping our minds open and participating with the market trend. My sense is that many traders and investors thought this 3-month congestion would lead, finally, to a meaningful decline. I have also been watching for the long-awaited correction. The decline could still happen. But I will do my best to stay mentally flexible to be able to take advantage of the actual price action.
If we are bearish and positioned accordingly, then we can try exiting our positions, clearing our mind as best as we can, and just waiting for the market to declare its intentions. The same goes for the bulls. If the breakout fails yet again, then we might try not trading until the true trend is revealed.
We see a breakout from a 3-week symmetrical triangle that may push SPY above resistance and possibly launch the next uptrend of this 6-year bull market.
Previously, we discussed possible bearish readings of the SPY chart. These bearish interpretations may still come true. After all, SPY has not yet decisively cleared resistance around the 212 level.
The key is not anticipating or predicting but keeping our minds open and participating with the market trend. My sense is that many traders and investors thought this 3-month congestion would lead, finally, to a meaningful decline. I have also been watching for the long-awaited correction. The decline could still happen. But I will do my best to stay mentally flexible to be able to take advantage of the actual price action.
If we are bearish and positioned accordingly, then we can try exiting our positions, clearing our mind as best as we can, and just waiting for the market to declare its intentions. The same goes for the bulls. If the breakout fails yet again, then we might try not trading until the true trend is revealed.
Wednesday, May 6, 2015
Update: $F breaking down from 3-month range-bound trading
Previously we discussed a possible bullish scenario for Ford. Now Ford is breaking down from a 3-month period of range-bound trading:
Remember, charting is all about possibilities. There are no guarantees in the market except risk. The possible breakdown in progress does not negate a possible longer term bullish scenario. But we must adjust our trading and thinking according to the price action. And the current action shows weakness. We must not solely focus on and wish for the bullish case because that's "supposed" to happen. Trading based on what "should" happen is costly.
Stocks are still range bound, but there are some interesting bearish possibilities
SPY has dropped 2% over 2 days, but it is still range bound :
In fact, we noted previously how SPY has been range bound for most of this year.
If we were to make a case for continued weakness in stocks, then we could point to SPY breaking below support of the rising channel/bear flag. There is also a possible 4-week H&S top forming. That said, such small patterns usually fail and the chart goes onto form something different. Still, traders must remain flexible and be open to different possibilities.
In fact, we noted previously how SPY has been range bound for most of this year.
If we were to make a case for continued weakness in stocks, then we could point to SPY breaking below support of the rising channel/bear flag. There is also a possible 4-week H&S top forming. That said, such small patterns usually fail and the chart goes onto form something different. Still, traders must remain flexible and be open to different possibilities.
Subscribe to:
Posts (Atom)