Wednesday, April 15, 2015

Stocks breaking out?

Yesterday, I discussed how the NYSE index was making a 5th attempt in 9 months to break above the July 2014 high. Today, about half way through the trading day, the NYSE index has finally overcome this stiff resistance level. Let's take a look:


Today's development doesn't mean an easy and straight path up. We should expect, as we always should, tough retests. We must also be ready for a reversal of the breakout and even pattern failure. Anything is possible. Indeed, stocks may retreat by the end of today and the NYSE index may close below the resistance that it overcame just hours ago.

That said, a strong, decisive, and sustained close above the July 2014 high suggests another advance for stocks.

If a trader is bearish, and I understand why a trader might be, this development will be frustrating. As I have noted, I am amazed at the historic run the market has been on since the March 2009 low. But it is futile to fight the market. Of course we know this, yet we still fight it because of pride, envy, greed, anger, denial, and other emotions that come with trading. We can always sit out and protect our capital when we are confused and emotional. There will always be more good set-ups to trade.

Tuesday, April 14, 2015

NYSE index making yet another attempt to break out higher

Here is the NYSE chart showing a possible continuation H&S bottom:


As I discussed 3 weeks ago, the NYSE index is showing a possible 9-month continuation H&S bottom. The previous four attempts to close above the July 2014 high have failed. The more a resistance level is challenged, the more likely prices break above resistance. That said, there is nothing inevitable about a breakout higher. Patterns can fail anytime. Traders must stay nimble and trade the actual price action.


American Airlines (AAL) chart analysis

Here is a 2-year chart of AAL:


Next, let's focus on the past 6 months:


As this rectangle develops, my goal is to stay patient rather than predict how this pattern resolves itself. If prices close decisively above the January and March highs, then I'll be looking to buy at a favorable spot that limits my risk should the breakout reverse. If prices decisively break down below the December, February, and March lows, then I'll be looking to short at a favorable spot that again controls risk. My goal is to participate in rather than anticipate the trend.

For more aggressive trading, I might look to buy shares at the bottom of the trading range and short shares at the top of the range. The next earnings report is due in a week or so. I almost never hold a position through an earnings announcement.


Friday, April 10, 2015

BAS: trying to breakout from a 5-month reversal rectangle?


First, the daily chart going back to November 2013:


The next chart focuses on the possible 5-month reversal rectangle:


Of course the breakout attempt can fail and this rectangle could turn into a continuation pattern that starts another downtrend. BAS is a volatile stock tied to a volatile commodity (oil) so a trader must be cautious and stick to rigid risk controls.


Thursday, April 9, 2015

CSV breaking out of a 2-year rectangle

First, let's look at the weekly chart of CSV:


Now, let's look at the daily chart and focus on the breakout:


I consider CSV a thinly-traded stock. I use extra caution when trading low-volume stocks such as CSV. Entering the trade only at a spot with a favorable reward-to-risk ratio, and even then only with a small position, is how a trader can manage risk with volatile and risky stocks such as CSV.

Tuesday, April 7, 2015

Chart analysis of Ford (F)

Here is a 2-year chart of Ford:


Now let's focus on the last 7 months:


Ford seems to have broken out of a textbook 5-point reversal symmetrical triangle in early February and has been trading in a tight range for 9 weeks. This range-bound action may lead to a breakout up or down. By the way, the measured move price target for the reversal symmetrical triangle is around 18, which is where long-term resistance holds.

And finally, a monthly chart going back to the 1990s:


This possibility may seem too incredible, but it is possible. Many things have to happen for this 15-year-plus H&S bottom to be realized. We should focus on possibly trading the next multi-week or multi-month pattern breakout. But it is always interesting and fun to think about what is possible in the big picture.

One reason why I keep this massive pattern possibility in mind is because it helps me fight my bearish bias for the market. The market has been on a historic run since the March 2009 bottom. Yet the market continues to go higher. Up and up. To my amazement. But I know that traders must accept and trade according to the actual price action and not what is "supposed to happen." We must always strive to stay mentally flexible and not succumb to our biases.

Monday, April 6, 2015

Chart analysis of AK Steel Holding (AKS)

First, the AKS chart going back to September 2013:


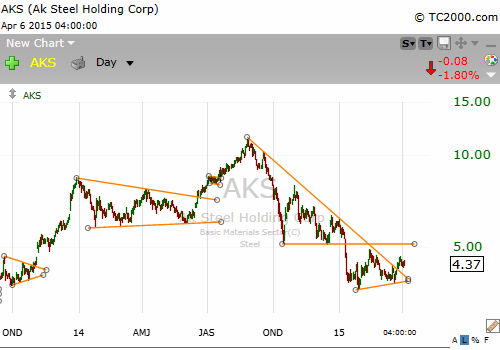
Now let's zoom in on the last 7 months or so:


Was that a trendline breakout on high volume in late March? Perhaps. Even if a breakout, I expect much back and forth and even a decline back to the trendline. Also, there is likely strong resistance at the $5 level.

AKS is a volatile and financially risky stock. If one is going to trade it, then one must use great caution. Using a small position is always a good way to limit risk. With a stock like AKS, the position size I use is the amount that, in the worst case scenario, I could lose entirely and still be a relatively minor loss for my trading account. There is nothing wrong with not trading a setup for whatever reason. Remember: there will always be more setups to trade. We must be patient.

AKS is due to release its earnings report in 3 weeks. I almost always exit my entire position before the earnings report. I think holding a stock through earnings is an unnecessary risk. There will likely be another chance to get in after the earnings announcement. And if no opportunity presents itself, then so be it. I move on.

The AKS chart shows possibly much potential as a long trade. But there is much work to be done and many hurdles to be cleared. As always, patience and strict risk control are required.