Our first chart is a weekly chart of the DIA (ETF that tracks the Dow Jones Industrial Average):
We see a clear Head & Shoulders Top that marked the 2007 peak in stocks.
Since bottoming in early 2009, stocks have been on a historic uptrend. However, things may be changing. A 7-year uptrend line was broken in mid-2015. Since then, stocks have been range bound. In fact, DIA has been range bound since early 2014, with the 152 level providing support and the 183 level being resistance.
The next chart is a weekly chart of DIA focusing on the last four years:
We see even more clearly the breaking of the 7-year uptrend and how stocks have been trading in a range since early 2014. Some people see another historic H&S top forming. Another massive topping pattern is possible. But there is always an alternative possibility. This range-bound trading could be a continuation pattern that continues the previous 7-year uptrend. Anything is possible. Traders must be open to all possibilities.
Let's now look at a daily chart of DIA since early 2015:
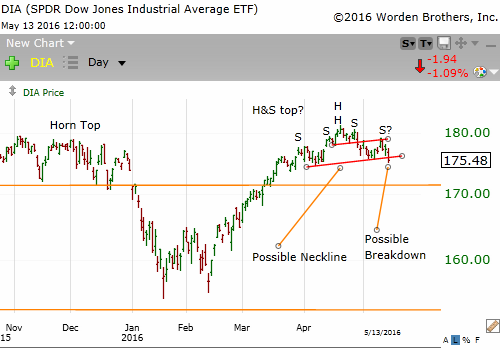
We see a well-defined complex H&S top that led to the sharp drop in August 2015. Then stocks rallied before forming a clean horn top that started the sharp decline in January 2016. Stocks rallied yet again for the last three months. Next is a daily chart focusing on the last 6 months:
I see a possible H&S top where the head itself is a small H&S top. Such a pattern within a pattern is fascinating. It can also give us good trade entry points. As of the market's close last Friday, prices closed below the possible neckline of this 6-week H&S top. Whether there is follow through and this pattern completes or changes into a different pattern and negates the H&S top interpretation remains to be seen. If the H&S top is triggered, then another question is how far stocks could fall.
Remember, be open to all possibilities. This H&S top can quickly change into a H&S top failure that starts yet another uptrend.
If stocks decline to the lows of early 2014, August 2015, and early 2016, then the big question will be whether the 153 level will again provide support or give way to a historic 2.5 year topping pattern. But we are getting ahead of ourselves. Let's first see if our 6-week H&S top interpretation becomes reality.


