Sunday, March 22, 2015

Another sign stocks are about to start another run higher: NYSE index trying to breakout

Previously, we discussed how the NYSE index has been forming a continuation H&S bottom, which, if completed, would push stocks higher to continue the current 6-year stock bull market. Here is the NYSE chart as of last Friday:


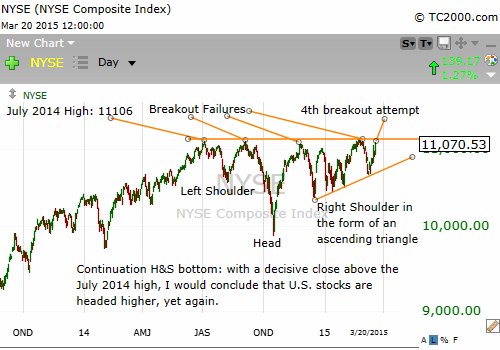
We see that the July 2014 high has rejected three attempts to break higher. Now stocks are making a fourth attempt to overcome the July 2014 high.

Do I think the NYSE index will break higher and complete the continuation H&S bottom? It is doesn't matter what I think. And I always try to remember that my main goal as a trader is to participate with the market trend rather than try to anticipate or predict the future. This mentality helps me accept the actual price action rather than get lost in my wishes and hopes.

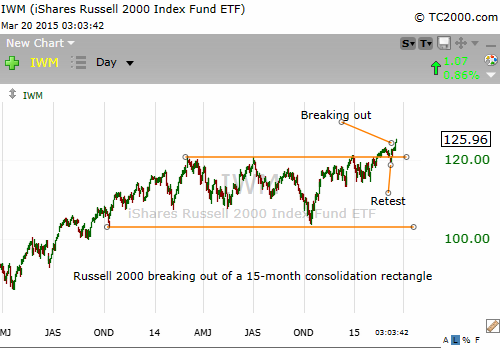
But if were to offer my opinion (run away everyone), I would say that I am looking for stocks to go higher and the NYSE index complete this big continuation H&S bottom pattern. Why? My main reason is that small-capitalization stocks as measured by the Russell 2000 index (symbol: IWM) has in the last couple of weeks broken out of a 16-month consolidation rectangle pattern as seen here:


Of course things can change quickly. But epic bull markets, like the current one, don't die easily. Still, traders must be mentally flexible. We have to avoid following conventional wisdom and ask uncomfortable questions. So we must ask whether there is a case for potential stock weakness based on classical charting principles. The following is one chart interpretation that urges caution:


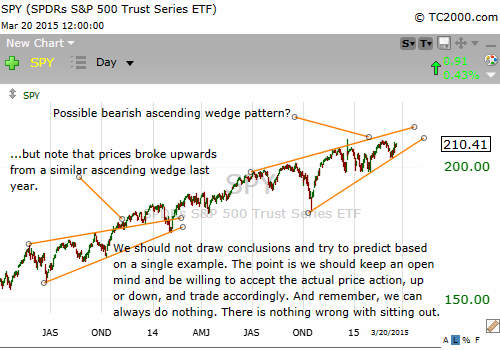
SPY, the ETF that tracks the S&P 500 index, is potentially forming a bearish ascending wedge. Remember that traders have different interpretations of the same chart. Some traders will disagree and see no ascending wedge. Personally, I think it is possible and reasonable for a trader to conclude that SPY's price action may be forming a bearish ascending wedge. Charting is about possibilities, and traders should challenge themselves to always try to see the other side of the argument.

As always, it will be interesting to see how the NYSE and SPY charts play out in the coming weeks.

Friday, March 20, 2015

Russell 2000 breaking out of 15-month consolidation

Here is the chart of IWM, the ETF that tracks the Russell 2000 index:


Is this the start of yet another uptrend in this 6-year bull market? I know many investors and traders will be in disbelief. I also have some difficulty accepting the incredible run of the stock market since the March 2009 low.

But a breakout is what the chart says.

I'll be looking at other indexes to see whether they follow the Russell 2000 and confirm the breakout.
Remember: if you don't believe in this breakout, then you don't have to trade it or invest in it. But don't go all in short because the market is doing what it is not supposed to do. Price is king, queen, and final.

Try to believe what you see, not what is supposed to happen.

Friday, March 6, 2015

Failed breakout in NYSE index

In my last post, I said that the NYSE index would have to decisively close and stay above the July 2014 high for a convincing breakout. The following chart shows that the NYSE was turned back at the old high:


This is the 4th time in less than a year that the NYSE index was turned back around the 11,100 level. Of course the market can attempt another breakout and this rejection could turn out to be a bear trap just as the breakout attempt turned out to be a bull trap.

What is clear is that, at least according to the NYSE index, the market is not ready to start yet another uptrend in this 6-year bull run.

Bears will be happy with this breakout failure. We'll have to wait to see if this rejection is the beginning of a significant market top or perhaps even a long-term top. But remember that many people have been calling, inaccurately, for a top for several years. We'll just have to wait for a resolution of this trading range.